Ranking
 Categories
 Historical Snapshots
 Token unlocks
 Yield
Yield Trending
 Upcoming
 Recently Added
 Gainers & Losers
 Most Visited
 Community Sentiment
 Chain Ranking
 Market Overview
 CoinMarketCap 100 Index
 Fear and Greed Index
 Altcoin Season Index
 Bitcoin Dominance
 Crypto ETFs
 Overall NFT Stats
 Upcoming Sales
 New Pairs
 Trending Pairs
 Meme Explorer
 Gainers & Losers
 Community Votes
 Top Traders
 Spot
Spot Derivatives
 Spot
Spot Derivatives
 Feeds
Feeds Topics
 Lives
Lives Articles
 Converter
 Newsletter
 CMC Labs
 Telegram Bot
 Advertise
 Crypto API
 Site Widgets
 Airdrops
 Diamond Rewards
 Learn & Earn
 ICO Calendar
 Events Calendar
 Academy
 Research
 Videos
 Glossary
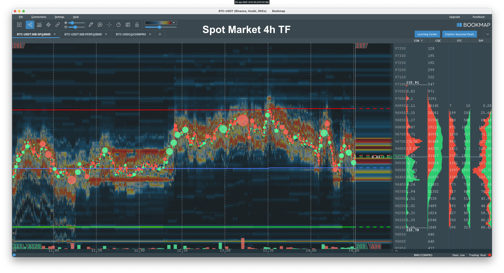
 $BTC data from Binance, Huobi, & OKX: All consolidated into a single chart. No distractions - all the essential insights are right here 👀
CQC (Chart Range Quotes Counter) - Liquidity Changes: CQC indicates how actively participants are placing, removing, or modifying orders at specific price levels. Levels with high CQC density suggest significant activity from Market Makers or manipulative behavior (e.g., Spoofing) or strong support/defense by large players.
What is Spoofing? Spoofing is a manipulative market strategy where a trader places large limit orders (Buy or Sell) without the intent to execute them. The goal is to mislead other participants about real demand or supply in the market and thereby influence the price.
STC (Session Range Trades Counter) - Number of Trades: STC shows the number of executed trades at specific price levels. High STC indicates zones with active trading and significant Buyer-Seller engagement.
SVP (Session Volume Profile): The Volume Profile displays where the highest trading volumes are concentrated. These zones often align with levels where both CQC & STC are high, confirming their importance.
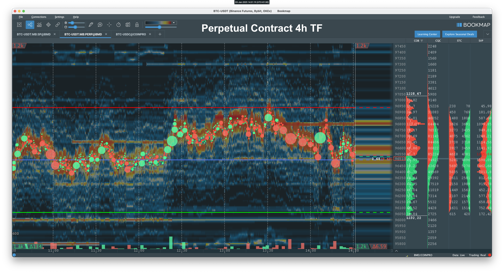
Relationship Between CQC & STC:
• High CQC + High STC: These are zones where both liquidity and trade activity are high. Such levels often serve as key support or resistance zones, confirming their significance.
• High CQC + Low STC: Indicates manipulative behavior or level defense without actual trade execution. These areas may involve Market Makers placing and removing orders to influence price movements.
• Low CQC + High STC: Shows that liquidity in the order book remains relatively stable, but a large number of trades are being executed. This suggests real trading activity, with participants actively engaging in trades while the order book changes minimally 🤓 #BTC Price Analysis# Stay Sharp ➖ DYOR 🧠 💡 #TeddyVision