Ranking
 Categories
 Historical Snapshots
 Token unlocks
 Yield
Yield Trending
 Upcoming
 Recently Added
 Gainers & Losers
 Most Visited
 Community Sentiment
 Chain Ranking
 Market Overview
 CoinMarketCap 100 Index
 Fear and Greed Index
 Altcoin Season Index
 Bitcoin Dominance
 Crypto ETFs
 Overall NFT Stats
 Upcoming Sales
 New Pairs
 Trending Pairs
 Meme Explorer
 Gainers & Losers
 Community Votes
 Top Traders
 Spot
Spot Derivatives
 Spot
Spot Derivatives
 Feeds
Feeds Topics
 Lives
Lives Articles
 Converter
 Newsletter
 CMC Labs
 Telegram Bot
 Advertise
 Crypto API
 Site Widgets
 Airdrops
 Diamond Rewards
 Learn & Earn
 ICO Calendar
 Events Calendar
 Academy
 Research
 Videos
 Glossary
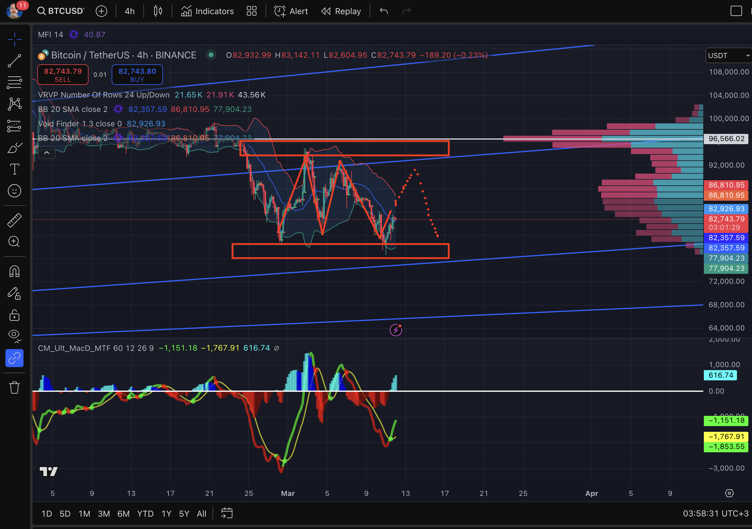
#Bitcoin at Key Levels: Can BTC Break the Resistance?
 $BTC is trading at $82,682, gaining 7.02% over the past 24 hours, with a market capitalization of $1.64T. However, the market remains tense: trading volumes have decreased by 7.05% over the past 24 hours, which may signal a local weakening of momentum.
Technical Analysis
On the 4-hour chart, we can see the formation of a consolidation range, bounded by support levels around $77,900–$78,000 and resistance in the $86,800–$87,000 zone. Within the channel, volatility is observed, which could lead to false breakouts.
📊 Key Points:
- Sales volumes are higher in the resistance zone, indicating active selling.
- The MACD indicator is signaling a potential upward reversal, but trend confirmation is still absent.
- Horizontal volumes (VPVR) show the greatest interest around $96,500, which could be a potential growth target.
What’s Next?
🔴 Bearish Scenario: If #BTC fails to hold above $83,000–$84,000, a pullback to $78,000 and a test of the lower channel boundary are possible.
🟢 Bullish Scenario: A breakout above $87,000 with rising volumes could pave the way to $90,000 and beyond.
Conclusion: The $BTC market remains in a phase of uncertainty. A breakout from key levels will determine the future price direction. Keep an eye on volumes and market reactions in support and resistance zones! 🚀